
Data Science with Python
After you've acquired Python programming skills, a Data Science course that focuses on data collection, preparation, visualization, and predictive modeling using Python is a must-have step. Sign up to learn more about the Data Science course curriculum.
Associated learning paths:
Data Science- About the Course
- Learning Outcomes
- Course Resources
- Apply now
- Instructor
- Reviews
About This Course
This 8-weekends Data Science with Python course is one of WeCloudData's signature product. Hundreds of students have participated in this course and taken their data analytics skills to the next level. You will meet hiring managers, product managers, directors, and many other professionals who come to this class to polish their python skills. The course is practical by design, and students learn how to carry out end-to-end data analysis, discover insight, and communicate analytical results through hands-on project implementations.
Who this course is for?

SAS, R and Excel Users
Learn data science the Pythonic way
Data Science Job Seekers
Build your data science portfolio with our mentorship
Data analytics professionals
Learn how to perform advanced analytics using Python
Product/Business managers
Learn end to end data science workflow and how data science can be used to improve your product and business
Engineers and developers
Apply your awesome coding skills to solve data science challenges

Learning Outcome
There's nothing textbook about our approach. With hands-on projects taught by data scientists who actually work in the field, you will learn the intuition, methodology, and end-to-end data science pipeline that you won't be able to learn from MOOCs. In this course, you will learn Pandas DataFrame for data munging and analysis, Numpy and Scipy for numerical computing, Matplotlib, Seaborn and Plotly for visualization, and Scikit-Learn for predictive modeling. You put these tools to use by implementing your own portfolio projects. Instructors will guide you on project scoping, data source research, data collection/scraping, as well as data analysis and presentation. It is a very business-driven and agile environment where students work either in groups or individually to tackle real-life data problems.
Learning Outcome
Upon completing the course, students will be able to:
- 01. Learn end to end data science process
- 02. Become a data munging master
- 03. Visualize data using Python
- 04. Learn math for data science
- 05. Develop predictive models
- 06. Build data science portfolio projects
Know how to start an end-to-end data analysis project
Don't become a "data scientist" who only knows how to work with Jupyter Notebook and Python packages. The job market needs candidates who understand things end to end and know how to collect data by writing a scraping job or calling a Data API, transform data into different shapes, discover insight via visualization, and do predictive analytics to support decision sciences.
- Decide how to scope a data project under time/budget constraints
- Set up data collection strategy
- Perform exploratory data analysis
- Transform, merge and aggregate data for predictive modeling
- Build regression or classification models
- Summarize and visualize analytical insights
- Communicate and suggest business strategies via presentations and documentation
Use Pandas DataFrame to work with various data structures
- Work with different data sources (csv, text, json, gzip, parquet, database)
- Filter and transform data using Pandas and Numpy
- Merge multiple datasets using DataFrame
- Aggregation data by columns using dataframe.groupby
- Use WINDOW functions to deal with rolling windows
- Treat missing and extreme values
Learn visual storytelling
A plot is worth more than thousand words! A data scientist will use visualization techniques for two purposes: explore and understand the data and communicate data insights to the business team. In this course, you will learn:
- Basic plotting using Matplotlib and Pandas
- Data exploration using Seaborn
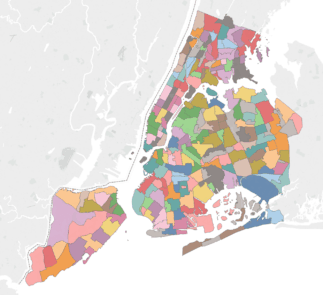
- Visualize geolocation data using Folium and GeoPandas
- Build and deploy interactive dashboard using Plotly Dash
How much math does a learner need to know?
In this module, you will learn enough math so that you can interpret a statistical distribution, handle data with skewed distributions, explore correlations between variables, perform regression analysis and interpret the results, understand statistical testing and sampling.
- Introduction to statistics and scipy
- Introduction to linear algebra and numpy
- Regression analysis 101
Here's the fun part!
In this course, you will learn two basic machine learning algorithms: linear regression and logistic regression. After this module, you will be able to confidently train regression models to forecast housing prices, and fit classification models to predict customer churn.
- Gradient descent
- Regression models using linear regression
- Classification models with logistic regression
Complete 2 end-to-end data analysis projects
Practice makes perfect. Students will come up with their own ideas and work on two capstone projects in this course so they can use it for job search. Original project ideas with strong motivation are always suggested.
- Data Collection and Visualization Project
- Machine Learning Project
Course Resources
Check out the presentation below to understand the Data Science job market trends and python use cases for data science!


Schedule
Instructors


What students are saying

I started this course without formal programming or statistic/math background. I really enjoyed the top-down approach used by the Instructor, not only does it keep you interested when learning the libraries and syntax, it also drives you to peruse more self-learning. The instructor along with the TA was very approachable and encouraging. I enjoyed showing them where I was in regards to the class projects and getting feedback on what I could try next. The live coding made the class engaging and not only helped show the process that a developer might take when solving a problem. This class was a great experience and I would definitely recommend it to not only those seeking careers in data science but for those who just want a general taste in programming as well.
Sinthushan Sooriyakumar
Excellent experience in Weclouddata! The courses are well-organized and keeping up with the ever-evolving data science trend. Each lecture covers a specific DS topic and theory, followed by a real coding demo session, which is really valuable for a data course. Plus, the assignment for each lecture is fully leveraging what has already been learned and requires students’ efforts to dig deeper — I only wish I would have more time after work to go over all of them. A TA session is also designed for each course, which usually occurs once every week or more often. I can always feel free to raise questions there or even offline on Slack. That’s quite supportive!"
Shelley Geng
This program is fantastic! I didn't have a coding background and the way they prepared each module made it easier to understand from basic concepts to Advanced SQL and Python for Data Science that I just finished. There are still 4 modules to go before I become a Data Scientist but it is all very exciting. They really do prepare you and offer great support (includes problem sets, individually and in group and quizzes). The teachers are well connected and help you, no matter the prior experience. When you graduate, you graduate with a portfolio of projects a very good understanding of academically and also hands-on practice what is important as they showcase your writing capability.
Celio Oliveira, Machine Learning Engineer, CloudPipe
Reach out for a Free Consultation